The psychology behind support and resistance
This has been discussed in another blog in detail but we will go over it quickly here.
Resistance level shows that supply has exceeded demand. At that level there are too many sellers and not enough buyers.
On the other hand, support level shows that demand has exceeded supply. At that level there are too many buyers and not enough sellers.
How do you know that a level is strong enough for a trader to trade?
Ideally if a level has been reached and has maintained itself three times, it is considerably sound. Of course there are no guarantees in forex, ever, but this is as confident as it is usually possible to be about a level.
The Buffer Zone of Support and Resistance
One thing to remember when you go out looking for support and resistance levels is that you should be basically be looking for a zone.

If the GBP/USD pair rose to 1.350 the first time, it will most likely not reach exactly there the second too. It is very likely that the next resistance level would be somewhere around 1.351 or 1.349. 1 pip or a pipette might see some change. It is just the general zone you need to be looking out for, not a specific rate exactly. This is also called a buffer zone.
For example, on a 15 minute charge these support and resistance zones may cover a range of 8-12 pips. Yes, this is how big of a range we’re talking. This is why it’s not that straight forward and why it’s easier said than done.
Two Types of Support and Resistance
- Horizontal
- Trending
Horizontal Support and Resistance
Horizontal support would mean that the price moves down to a certain point, goes up, and then comes back down to almost exactly that same point.

If you were to connect all the support levels, they would form a horizontal line, meaning the trend is probably sideways. That is, it’s neither going considerably up nor down, there is a sideways range and it falls in those upper and lower limits.
Trending Support and Resistance
This is when support and resistance form and contribute to an upwards or downwards trend. Trending support and resistance is a bit more tricky than horizontal though.
The reason for that is that these levels are not clearly defined when the market is moving consistently up and down. Different traders who look at this chart will identify support at different levels. This type of analysis then is quite subjective.
That’s not to say that you can’t spot a strong level when the market is trending but it is generally advised to proceed with caution when it comes to these.
Trading at Support and Resistance
The plan of action is probably obvious now. If you are planning to support or resistance then you need to keep an eye out for established levels. Usually the recommended practice is to only trust horizontal support and resistance levels.
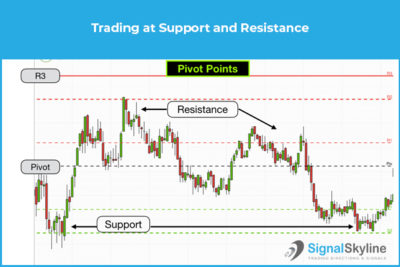
A buyer or bull will enter the trade at support, and a seller or bear will enter the trade at resistance. If you were right and the level holds then entering close to support for a buyer will mean that they can take advantage of the move up and make maximum profit.
On the other hand, entering close to resistance for a seller would mean that they can take complete advantage of the move down and make maximum profit.
There is a lot more to it of course because nothing is set in stone in forex. However, what each trader chooses to do with this information is going to be a very subjective decision and approach. Proceed with caution is all we can say. Good luck!