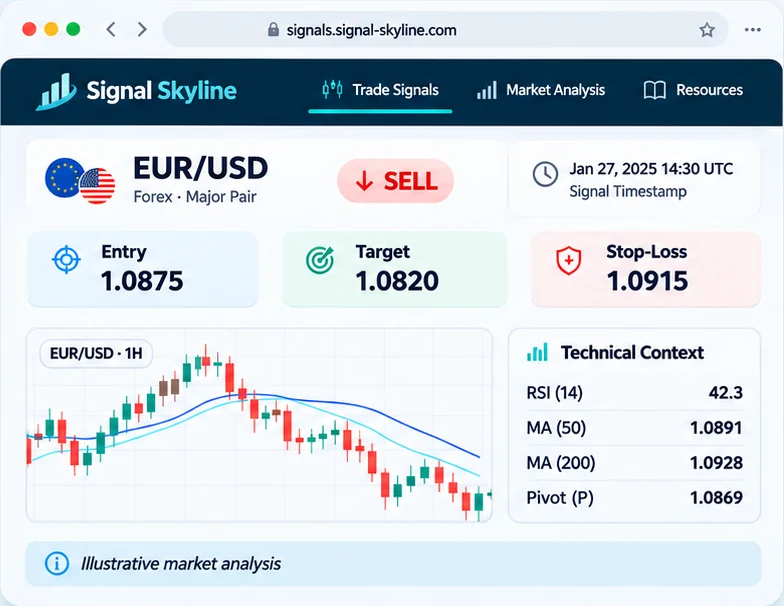
Forex signal · EUR/USD SELL
Historical example · Not an active signal
- Entry (USD per euro)
- 1.1022
- (historical)
- Target (USD per euro)
- 1.10149
- (historical)
- Stop-loss (USD per euro)
- 1.10291
- (historical)
Subscribe to Signal Skyline for trading alerts based on technical analysis. Each alert includes a proposed entry, target and stop-loss level for you to review.
Our signals provide easy-to-follow
All trading involves risk. It is possible to lose your all capital.
HOW SIGNAL SKYLINE WORKS
Signal Skyline turns market data and technical analysis into structured, easy-to-review trade ideas for forex, gold and oil, for users to evaluate against their own plan.
Direction, entry, targets and stop-loss in one view.
Indicators, moving averages and pivot levels with source timestamps.
Informational analysis, no execution and no promise of outcomes.
Choose a market to preview a subscriber email.
See how an EUR/USD idea arrives in your inbox with a proposed entry, target and stop-loss.
Explore EUR/USD trading signals →Review a gold setup with the entry, target and stop-loss together in your inbox.
Explore gold trading signals →Review a WTI crude oil setup with the proposed entry, target and stop-loss in US dollars per barrel.
Explore crude oil trading signals →Example subscriber alert
Historical example · Not an active signal
Illustrative sample · Not an active signal
This example looks for a pullback from resistance. A move above the stop-loss level would invalidate the idea.
Illustrative sample · Not an active signal
This illustrative WTI setup uses a target above the entry and a stop below it. The levels demonstrate how a buy idea is presented.
Signup takes only 45 seconds. Leave whenever you want.
$7 for the first 7 days, then $49 per month. Renews automatically each month unless cancelled.
Our best selling package. Don’t miss opportunity with Realtime notification.
Premium support with great saving. 3 months non-stop quality signals
Special made for full time trader. Expert level with maximum articles offered
Review one currency, gold and WTI in the first row, followed by three additional currency markets.
Technical vote: 78.89% buy · 21.11% sell
Source observation: 20 Nov 2026, 21:54 UTC
Last updated: 20 Nov 2026, 21:54:55 UTC
Technical vote: 90.00% buy · 10.00% sell
Source observation: 20 Nov 2026, 21:54 UTC
Last updated: 20 Nov 2026, 21:54:59 UTC
Technical vote: 35.18% buy · 64.82% sell
Source observation: 20 Nov 2026, 21:58 UTC
Last updated: 20 Nov 2026, 21:58:52 UTC
Technical vote: 81.48% buy · 18.52% sell
Source observation: 20 Nov 2026, 21:54 UTC
Last updated: 20 Nov 2026, 21:54:59 UTC
Technical vote: 12.96% buy · 87.04% sell
Source observation: 20 Nov 2026, 21:54 UTC
Last updated: 20 Nov 2026, 21:54:59 UTC
Technical vote: 31.48% buy · 68.52% sell
Source observation: 20 Nov 2026, 21:54 UTC
Last updated: 20 Nov 2026, 21:54:58 UTC
Quotes and changes use the existing production records for each instrument. A market reading is not a trading signal.
Open currency overview
Right entry is most crucial. Vital entry point signal-out for every trade
Always Enter with exit strategy. Clear take profit indication will be provided
Don’t trade without limit. Well calculated stop loss provided for each trade

What is better, risking full investment or try price forecast and signal service for 1 Month. You can try our service one month with your demo parallel system. You will compare and see difference by yourself. Do not take risk. Join team of expert...

+1 888-877-1301
(Canada/USA Toll-Free)

250, Younge Street, Toronto ON, Canada
Canada. Postal Code: M5B 2L7

For sales questions, please call +1 888-877-1301 (Canada/USA Toll-Free). . All rights reserved..
Disclaimer: Online trading involves significant risk. We make no guarantees that our product will produce any particular result for you. It is not lawful to guarantee online trading activity results. The sites visitors and subscribers access to information contained in this web site is on the condition that errors or omissions shall not be made the basis for any claim, demand, or cause of action against OWNER or anyone affiliated therewith.
Online trading has large potential rewards, but
also large potential risk. You must be aware of the risks and be willing to accept them in order
to invest in the Forex, Futures, Stock, and/or Options markets. Don’t trade with money you can’t
afford to lose. Trade at your own risk. All information and material purchased from this is for
educational and advise purposes only and is not intended to provide financial advice. We are not
nor affiliated with any trading housing, bank or financial institution. We analysis the market
and forecast based on certain criteria. You must consult and follow your trading platform risk
disclosure, disclaimer and all other relevant documents.
Risk Warning: Any opinions, news,
research, analysis, prices, trade discussions or other information contained on this website are
educational in nature and merely provided as a presentation of trading strategies. Commentaries
made on this website reflect our own opinions and trading techniques and do NOT constitute
investment advice. We are not registered investment advisors. OWNER will not accept liability
for any loss or damage, including without limitation to, any loss of profit, which may arise
directly or indirectly from use of or reliance on such information.The sites visitors and
subscribers access to information contained in this web site is on the condition that errors or
omissions shall not be made the basis for any claim, demand, or cause of action against OWNER or
anyone affiliated therewith.Forex, Futures, Margined Forex trading have large potential rewards,
but also large potential risk. You must be aware of the risks and be willing to accept them in
order to invest in the Forex, Futures, Stock, and/or Options markets. Don’t trade with money you
can’t afford to lose.This is neither a solicitation nor an offer to Buy/Sell Currencies,
Futures, Stock, and Options.No representation is being made that any account will or is likely
to achieve profits or losses similar to those discussed on this web site. The past performance
of any trading system or methodology is not necessarily indicative of future results.Trade at
your own risk. All information and material purchased from this is for educational purposes only
and is not intended to provide financial advice.Any statements about profits or income,
expressed or implied, do not represent a guarantee. Your actual trading may result in losses as
no trading system is guaranteed. You accept full responsibilities for your actions, trades,
profits or losses, and agree to hold OWNER and any authorized distributors of this information
harmless in any and all ways.OWNER assumes no responsibility for errors, inaccuracies or
omissions in these materials. They do not warrant the accuracy or completeness of the
information, text, graphics, links or other items contained within these materials.OWNER shall
not be liable for any special, indirect, incidental, or consequential damages, including without
limitation losses, lost revenues, or lost profits that may result from these materials. This
website and its email are not a solicitation to buy or sell currency.By purchasing products and
services from OWNER, you acknowledge and accept that all trading decisions are your own sole
responsibility, and the author, and anybody associated with OWNER cannot be held responsible for
any losses that are incurred as a result.
Signals Disclaimer: OWNER services are
speculative trading techniques designed to buy and sell margined FX contracts. No claims as to
past, present or future profitability of these signal services or other OWNER methods are made,
and there is no guarantee that our system and techniques will provide any profits to traders
using the system and techniques, and indeed may cause such traders to incur losses.All signals
generated are provided for educational purposes only. Any trades placed upon reliance on signals
are taken at your own risk for your own account. Past performance is no guarantee of future
results. While there is great potential for reward when trading margined FX, there is also
substantial risk of loss. You must decide your own suitability to trade.Future trading results
can never be guaranteed. This is not an offer to buy or sell currencies, futures, options or
commodity interests. The signals generated by OWNER and/or copied to client account are based on
historical formulas which have worked in the past. However, what has happened before may or may
not happen again. You can lose all your money trading Forex and you must decide your own
suitability as to whether or not to trade. Only trade with true risk capital you can afford to
lose. Only trade markets you can properly afford to trade. Properly funded trading accounts
typically perform better than those that are not.

Analyst comment
The rebound faded near a technical level. The closing candle and directional strength supported the sell idea.