Types of Candlesticks
In this section, we will discuss the various candle formations. These represent different kinds of price action and are good depicters of market sentiment. There are five types that we will discuss here
- The Doji Candlestick Formation
- The Hammer Candlestick Formation
- Spinning Tops
- Engulfing Candles
- Tweezer tops and bottoms
The Doji Candlestick Formation
A Doji Candlestick shows that the opening and closing rates were either the same or very close. It shows that for a certain period of time (whichever time unit the candle represents) the buyers and sellers were unsure of the direction.
This formation is the most useful when it occurs at support or resistance levels after a gap because it can indicate a reversal which, if you can identify at the right time, can really help you make the right move.
The doji may manifest in one of these three shapes
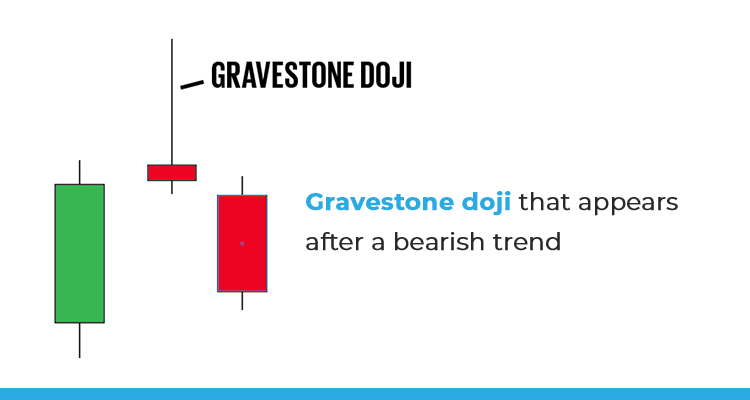
Gravestone- type of doji that appears after a bearish trend. It marks reversal.
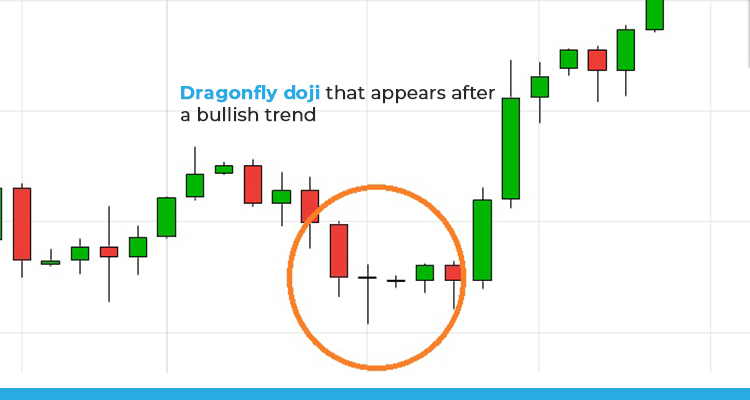
Dragonfly- type of doji that appears after a bullish trend. It marks reversal.
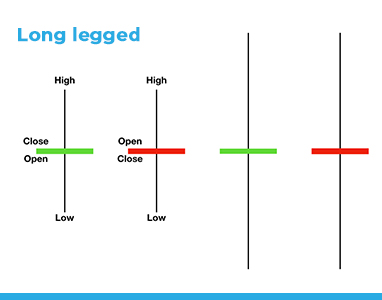
Long legged- type of doji that shows no one knows what to do because there has been a lack of price action after a strong trend in one direction. After this pattern emerges there may be reversal or consolidation.
The Hammer Candlestick Formation
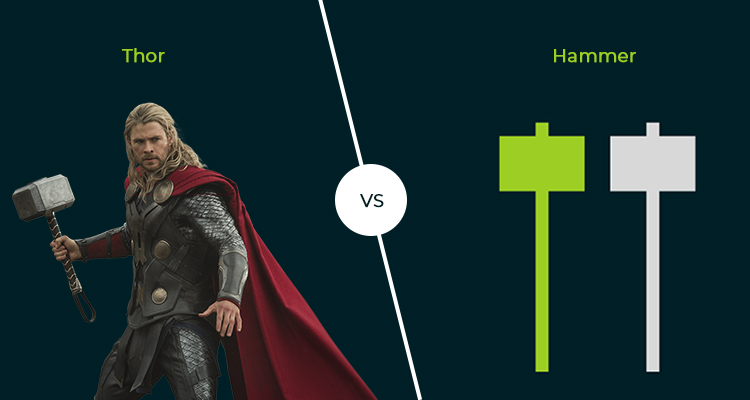
Imagine Thor’s hammer-that’s what this formation looks like with a little wick sometimes.
There are inverted hammers too which are basically the same as a regular hammer but only inverted.
It is formed when there is a reversal, when price moves below the opening rate but then recovers and either comes to the same level or moves higher.
The hammer may take one of these two forms
Hanging man- type of hammer formation that starts after an uptrend. It may be bullish or bearish.
Shooting star- the same as a hanging man except it’s inverted. It also starts after an uptrend and may be bullish or bearish.
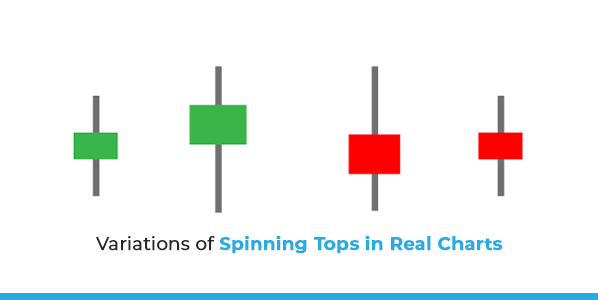
Spinning Tops
Spinning tops have long upper and lower shadows and a small body.
It signifies indecision and means that both bulls and bears were unable to start a trend even though there was a struggle from both ends.
Engulfing candles
Engulfing candles occur in pairs and it’s the order of the pairing that will serve as an indicator.
Bullish engulfing candle pattern would appear as a small dark (or red) candle followed by a bigger light (or green candle). It signifies that the bulls were able to overpower the bears.
Bearish engulfing candle pattern would appear as a small light candle followed by a larger dark candle and would signify that the bears overpowered the bulls.
Tweezer Tops and Bottoms
These are candlestick patterns that appear in pairs of bullish and bearish candles, like the engulfing candles. These usually have long bodies and indicate a reversal.
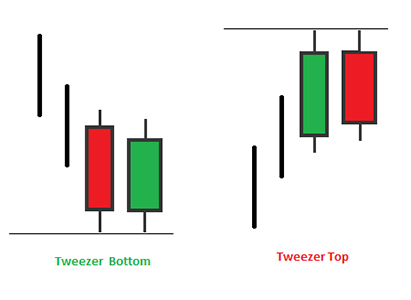
A tweezer top would appear in a bullish trend. Here the top of both the candles would be the same and the bottom of the bearish candle would be lower than the bullish one. This means that the highs are now at a standstill and the lows are getting lower. Therefore, the bullish trend will most likely be turning into a bearish trend soon.
A tweezer bottom is the opposite of the former. So it appears in a down trend and here the lows are at the same level but the high seems to be getting higher. And so it indicates that the bulls are driving the prices up and the trend is due to change soon.
These are the main candlestick patterns that traders look for during technical analysis of the charts to see if they can find something about a forming trend or a reversal to then adjust their strategies accordingly.
In the next lesson, we discuss how to develop a trading plan and deciding how much you will rely on these candlesticks for your trades.