
Technical indicators present past data from market movements and are used to calculate future probabilities.
In this blog, we highlight some of the most important and useful indicators that can be used for a good technical analysis and to make an informed decision.
The first thing to keep in mind about technical indicators is that they are only supposed to be used for probability measuring- i.e. figuring out what is the probability of an event. Technical indicators are not going to help you predict the future or occurrence of events.

Even after they strongly indicate in a direction, it only means there is a good chance or probability that the market will take that direction, not a guarantee.
It’s also good to remember that technical indicators are based on data collected from previous trades. Each trade is different and so it is possible that historical information might not be good enough to correctly ascertain future market movements.
Also remember that an indicator should not be used in isolation. It should be used in combination with others.
Given below are some indicators that can prove to be very helpful in measuring out probabilities, but of course like we said before, don’t rely on them to predict market movements.
Moving averages
Moving averages show a clear view of the price action. They take out the inconsequential short term price fluctuations.
The Simple Moving Average (SMA) and Exponential Moving Average (EMA) are the two types of moving averages.
They help with tracing the support and resistance levels to help the trader figure out what boundaries the prices are likely to touch and then reverse from.

Moving average is the most commonly used technical indicator and is recommended for use by all indicators. Again, it should be kept in mind that they are showing past data only and so the future movement cannot be ascertained. However, for assistance, they are very helpful.
Parabolic SAR
The Parabolic Stop And Reverse indicator is very useful for trend following. It indicates bullish and bearish momentum.
The way it will appear on a chart will be in the form of black dots. If the momentum is bullish, the dots will show below the trend lines, and if it is bearish they will show above the trend lines.

This indicator does not work well with sideways trends though. With up or down trends it is quite useful.
MACD (Moving Average Convergence, Divergence)
MACD helps compare moving averages. It is good to trace moving averages as well as the oscillation (which means the counter movement of a currency).

You read it by looking at the movement of black and red lines. The black represents the MACD line and the red one is the signal line or the zero line. If the black line is above the red one, it is showing bullish momentum. If the black line is below the red one, is showing bearish momentum.
If you’re going long you want bullish momentum, and if you’re going short you want bearish momentum.
Force Index
The force index tells you how much force or volume is behind a trade.
It is calculated by the following formula
(Closing price today- Closing price yesterday) x Today’s Volume
The way this can help you is by helping you see what’s going on underneath the surface. So if a trend is going up and the Force Index is going down, it means that the volume is decreasing and the trend will probably come back down soon. So it prepares you for the future.

If you are holding a position and you’ve already made good profit, you might want to get out if the Force Index is going in the negative.
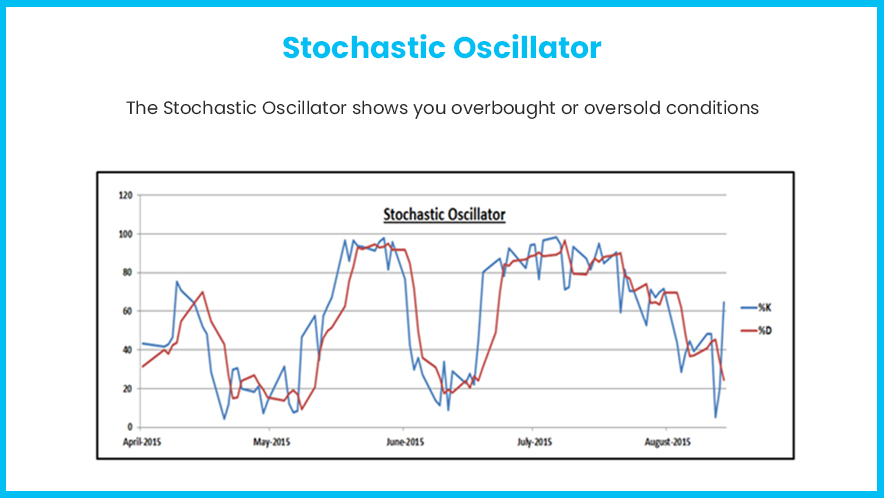
Stochastic Oscillator
The Stochastic Oscillator shows you overbought or oversold conditions. Overbought and oversold indication is important because it shows you when to expect the trend to go down when it has been going up for a while.
If a price goes too high too fast, it means that that pair is on the verge of being overbought and consequently it will come back down. So it warns any traders who might be about to enter a trade looking at the trend that it might soon come back down due to the corrective wave.
Similarly, if it comes down too quickly that shows that it is oversold and so it will soon bounce back and so you need to act accordingly.
The Stochastic Oscillator therefore shows probability of the counter movement.
Bollinger Bands
This indicator is also useful for counter trend trading. Furthermore, it works best for short term trading. So, you’ve really got to have a good grip on your strategy to make good use of this one. It might not be too useful for those who are only beginning to learn.
These also show you when a currency pair is overbought or oversold. The way they work is by using two standard deviations in upward movement and two standard deviations in the downward movement to plot boundaries (upper and lower) which are called Bollinger Bands.

These bands act almost like support and resistance levels. So when the price reaches the Bollinger band it might face resistance and come back down or when it touches the lower band, it might find support and bounce back up.
Also, when the price touches a point above the upper Bollinger band, it is an indication that it is overbought, and so will probably come back down. Similar thing happens with the lower band but with that it will go up of course.
Williams % R
This stands for Williams Percentage Range. Again, it indicates overbought and oversold conditions. And similar to the Bollinger bands and Stochastic oscillator it can show you when to exit or enter a trade. It gets its name from Larry Williams, the man who developed it.
It moves between 0 to -100. If the reading is above -20, that means the pair is overbought. And a reading above -80 would mean that it is oversold.
It should be kept in mind that all these indicators for the counter movement of prices do not necessarily forecast a reversal. They only show that the price is in its high or low range. A reversal is probable, but not certain.
There are over 300 technical indicators. Here we talked about only seven. These were chosen because they are very commonly used and considered to be quite efficient.
However, as stated before do not take an indication to be a prediction. At the end of the day your strategy and experience should dictate the move you decide to make.


